PNSN Virtual Lab Tour
Welcome to the Pacific Northwest Seismic Network's Virtual Lab Tour.
Many of the topics covered in the PNSN Virtual Lab Tour, and the associated videos and pictures, are the same things you would see and hear in an actual tour the the PNSN Seismology Lab. The Virtual Lab Tour is designed to give a comprehensive overview of the PNSN and provide a general introduction to seismology.
The following sections will introduce you to several topics including; what is the PNSN, how do we locate and assign magnitudes to earthquakes, what causes earthquakes, what types of earthquakes occur in the Pacific Northwest, and what are some of the digital products the PNSN produces associated with seismic events in the region. Use the side bar on the left to navitage through the different sections or just keep scrolling down the page.
Introduction to the Pacific Northwest Seismic Network
What is the PNSN?
To monitor earthquake and volcanic activity across the Pacific Northwest, the University of Washington and the University of Oregon cooperatively operate the Pacific Northwest Seismic Network (PNSN). The PNSN is sponsored by the U.S. Geological Survey (USGS), the U.S. Department of Energy, the State of Washington, and the State of Oregon. Beginning in 1969 with five seismometers, the PNSN has grown to more than 300 seismograph stations distributed across the region and has become the second largest seismic network in the United States. The PNSN is an organization dedicated to reducing impacts of earthquakes and volcanic eruptions in the states of Washington and Oregon by providing accurate and fast information about earthquakes and ground motions to scientists, engineers, planners, and the public.
Where is the PNSN?
Our headquarters is at the Department of Earth and Space Sciences at the University of Washington. However, we have offices and personnel in several locations in the region, seismic stations spread far and wide over the two states, and deep collaborations with other institutions inside and outside of Cascadia that make it a bit of a challenge to sharply define our organizational boundaries.
The locations of the seismic stations that the PNSN operates range from the flanks of Mount Rainier and remote areas of the Pacific Coast to schools and fire stations in the urban areas of Washington and Oregon. Check out the Seismograms Map page for the full picture and view data from our realtime stations.
Who works at the PNSN?
The PNSN is comprised of USGS, University of Washington, and University of Oregon employees. In total there are nearly 30 employees, most of which work at the Univeristy of Washington. They can be divided into three main categories: Seismologists & Researchers, Field Engineers & Technicians, and Computing & Web Specialists. The PNSN and ESS Department at UW are also home to several graduate students and postdoctoral scholars who contribute to the network as well as undergraduate students who work in the Seismology Lab.
Seismology: The Study of Earthquakes
Seismometers
The equipment used in the field to measure the ground motion is a device called a seismometer. The Pacific Northwest Seismograph network has over 300 seismometers in the field throughout Washington and Oregon continuously recording local earthquakes, larger regional earthquakes that send seismic signals vast distances across the surface, and teleseismic events which are very large earthquakes from all over the world that send energy through the interior of the earth.
There are different kinds of seismometers out in the field as well. There are what are called strong motion seismometers used for measuring earthquakes greater than a 2.0 magnitude, and there are short period instruments used for measuring smaller earthquakes and other various motions such as those caused by a rock fall. These short period stations are so sensitive that we can read when a person walks by one of them! Actually, anything that causes shaking of the ground will be recorded by seismometers if the motion is strong enough; avalanches, rockfalls, trains, trucks, fans in CenturyLink Field during Seahawks games, even sonic booms caused by jet airplanes can be recorded by our most sensitive instruments.
Short Period Instruments use a simple spring and mass to record motion. In the instrument below the the spring and mass are designed to record vertical shaking but short period instruments can also be set up to measure horizontal motion as well. They are best utilized for earthquakes with a magnitude lower than 2.0 or earthquakes at a great distance. The typical amplitude of earthquakes that are recorded by short period instruments ~1Hz.

Strong Motion Instruments are designed to do just that, record earthquakes that are greater than magnitude 2.0 up to magnitude 9.This range of magnitudes would be the range of shaking that humans can percieve all the way up to severely damaging. Typically they record on 3 channels, in three different directions of motion; vertical, horizontally in the N-S direction, and horizontally in the E-W direction. These instruments can also capture a broad range of wavelengths from 0-100Hz. Digital strong motion instruments require more power to operate than short period instruments. This coupled with the fact that they are designed to record strong shaking that may damage infrastructur and harm people mean most of the PNSN strong motion instruments are placed in the urban areas like the Puget Sound and Portland. They are also being placed along the coastline fully characterize the seismic energy released in large subduction zone events.


Seismic Waves
Earthquakes shake the ground because fault rupture releases vibrations that radiate in the form of seismic energy. These earthquake waves, also called body waves, come in two distinct forms: Primary or "P" waves and Secondary, Shear or "S" waves. These two waves are released simultaneously when an earthquake occurs. P Waves travel through the crust at rougly 6 km/s and S Waves travel at roughly 4 km/s. Each of these velocities change depending on the density of the material through which the wave travels. Keep these differing travel times in mind as they are the key to locating earthquakes.
When these body waves reach the free surface of the earth, some of their energy is converted into complex surface waves that are trapped near the surface of the earth and that produce generally lower frequency ground motions.
P Waves
P waves are compressional waves that do not produce much damage. They can move through any type of material and travel at almost twice the speed of S waves. High frequency P waves do not weaken or attenuate as rapidly as S waves so they retain higher frequencies when they arrive at seismic stations.
S Waves
S waves are shear waves that deform the ground perpendicular to their direction of travel. Unlike P waves, S waves are unable to pass through air and liquids such as water and magma. This is how we know Earth’s outer core is molten – these waves cannot pass through it! When S waves deform the ground, it causes lateral or shear (back and forth) forces on structures. Older buildings were constructed primarily to withstand gravity (vertical forces); therefore they are more prone to fail due to the strong lateral loading experienced during a big earthquake.
Surface Waves
When P and S waves arrive at the surface of the Earth, part of the energy is trapped and guided by Earth's surface. Their behavior is different than for body waves, so we say they are converted to Surface Waves. The two types are Love waves and Rayleigh waves.
Rayleigh waves produce a long rolling motion along the earth's surface much like the motion in a boat on the open sea. They travel a little slower than Love waves.
Love waves have horizontal motion that is perpendicular to the direction the wave is traveling.
Earthquake Location
Earthquakes are located by calulating the arrival differential of the P & S Waves. Remember that the S Wave only travels at about 0.6 times the speed of a P Wave and both are released by an earthquake at the same time. The seismic stations and computer processing necessary for earthquake location depend heavily on very accurately timed data. Calulations on the P Wave arrival and S Wave arrival are determined down to the millisecond. The difference between the two arrivals is called the P-S Wave Differential. The longer the differential is the further away the epicenter of the earthquake must be.
Remember back to your high school math classes. If two trains (the P and S Waves) leave the station (epicenter) at the exact same time but one is traveling faster than the other they will of course arrive at their destination (seismic stations) at separate times. The further away the destination the further apart the trains becomes. By calculating exactly how far apart the arrivals of the P and S Waves are seismologist just do a backwards calculation to determin exactly how far away the epicenter had to have been. By doing this for several different seismic stations a very accurate location can be triangulated. See the example below.
For our purposes lets say the P-S Wave Differential time calculation for the first seismic station tells us that the earthquake occured 10km away from the station. The earthquake could have occured at any point that is 10km away from the station and thus the circle.

Now lets look at another station. We must measure the P and S-Waves to find out that the earthquake happend 5km away from the station. So we do the same thing, draw a circle around the station that is 5km in radius. We can now deduce that the earthquake happened at one of two points that satisfy both conditions; 10km from the first station and 5km from the second.

Now we take a third station and again do the same thing. The final station P and S-Wave Differential calculates to 8km from the station. Again, a third circle is drawn with a radius of 8km. Now, if we did this right, the three circles should intersect at one point. We have found the epicenter of the earthquake!

IRIS has a wonderful interactive demonstration of P-S wave travel time and location. Hover over both of the hand icons below the map to see spread of the waves and the math behind the wave propegation. Also, hover over the walk-run icon at the top for a similar active demonstration.
Magnitude and Intensity
Magnitude and Intensity of an earthquake are actually a reference to two separately measured characteristics. The USGS page related to Magnitude and Intensity states that Magnitude measures the energy released at the source of the earthquake. Magnitude is determined from measurements on seismographs. Intensity is determined from the effects on people, human structures, and the natural environment. The PNSN has an extensive section on Magnitude and Intensity. Our website has a more in depth section for the way magnitude is derived and the Mercalli Intensity Scale. In short, the difference between the two is that any given earthquake has a definitive magnitude, but the intensity at which it is felt decreases the further away from the epicenter you are. Therefore, for any number of locations the Mercalli Intensity will vary.
The magnitude scale most commonly thought of is the Richter Magnitude, referred to now as the Local Magnitude (ML), which is based on the recorded amplitude of seismic waves. This scale relies on a base-10 logarithm of peak amplitude, meaning each whole number increase on the scale corresponds to a 10x increase in amplitude.

The Modified Mercalli Intensity Scale is a better way to characterize the intensity of, or shaking felt from, an earthquake at any given location and distance away from the epicenter of the event. Rather than using the magnitude of the earthquake, which may be many miles away from the recording location, the MMI scale characterizes the motion felt by citizens and structures alike at any given location. This intensity of an earthquake, typically give in the Peak Ground Acceleration or the %g (percentage of gravity), correlates to a number (I-XII) and a description of the shaking felt from Weak/Not Felt to Extreme.

Earthquake Sources
Plate Tectonics
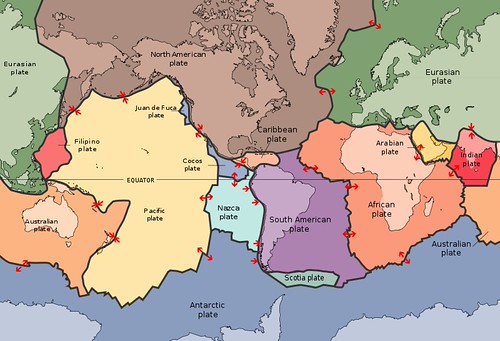
Plate tectonics describes the motions of the 15 to 20 large rigid and brittle tectonic plates into which the Earth's outermost layer (called the "lithosphere") is broken. It explains the distribution of most of Earth's earthquakes, mountains and other geological features, and a particularly good job at explaining features on the ocean floor. However, it is challenged to explain the details of the older rocks on the continents, and the occurrence of deformation and earthquakes off of plate boundaries.
Beyond merely describing current plate motions, Plate Tectonics provides an overarching framework that connects many elements of Earth science. Plate tectonics is a relatively young scientific theory that needed the advancement of observational and computing technology in the 1950s and 1960s to become fully elaborated. Its explanatory gravitas and the weight of observational evidence overcame much initial skepticism over how mobile the Earth's surface really is, and Plate Tectonics quickly became universally accepted by scientists throughout the world.
This animation shows, in a very exaggerated way, the sorts of movements Plate Tectonics implies. Plate Tectonics is a theory of motions at the Earth's surface, but to drive those motions, it relies on a planet with a very active inner life. It is important to remember that the one-minute-long movie actually represents millions of years!
This is a map of the main tectonic plates that comprise the Earth's surface:
Faults
Faults are cracks within the Earth's crust where rock, due to the build up of stresses, periodically breaks and moves, releasing seismic energy in an earthquake.
Stresses in rock are usually in a state of equilibrium, meaning all the forces acting on the body of rock are balanced by opposing forces. The overall stress levels can increase slowly, ultimately due to the movement of crustal plates, so the equilibrium is disturbed. At weak spots or previously fractured spots within the rock (faults) a temporary disequilibrium of stresses during an earthquake causes slip. Rock on either side of fault is temporarily in motion as it accelerates until it relieves the pent-up elastic stresses then comes to a stop as the equilibrium is re-established.
The amount of slip along a fault correlates to the energy released i.e. magnitude of seismic events. Larger magnitude events are caused by greater amounts of slip. Therefore. larger fault lines are capable of producing larger magnitude earthquakes. For example, the Cascadia Subduction Zone can produce earthquakes of magnitude 9+ while the much shorter Seattle Fault can produce up to magnitude 7+ earthquakes.
There are three main types of faults; strike-slip faults, normal faults, and reverse faults.
Strike-Slip faults occur when the two sides of a fault line slip paste each other like you are rubbing your hands together. Neither side of the fault rises past the other, it is simply side to side motion. The most famous example of a strike-slip fault is the San Andreas fault in California.
Normal faults occur when two sides of a fault line are being extended or pulled away from each other. The dominant type of faulting in the Pacific Northwest is due to compression so there are very few normal faults in Washington and Oregon, but the eastern side of both states do have examples of this type of extensional tectonic motion.
Reverse faults occur when the two sides of a fault line are compressed together. One block moves up over the other. The Seattle Fault is a good example of a reverse fault. When earthquakes occur on the Seattle Fault the south side of the fault moves up relative to the north side. A thrust fault is a unique form of reverse fault that has a very shallow strike angle. The Cascadia Subduction Zone along the coast is an which is a reverse fault is an example of a low angle or thrust fault.
The image below is a snapshot from the PNSN Recent Earthquake webpage with the subduction zone fault line and other known crustal faults mapped onto it.

Cascadia Earthquake Sources
The Pacific Northwest is located at a convergent continental boundary between the North American and Juan de Fuca plates, where the two tectonic plates are colliding. This boundary is called the Cascadia Subduction Zone. It lies just offshore and runs from British Columbia to Northern California. The ocean plate is converging under the North American plate at a rate of about 3-4 cm/year (1-2 inches/year). This convergence cause elastic stress to accumulate in the rocks around the zone. Earthquakes are cause by the abrupt slipping on a fault that suddenly releases this slowly accumulated stress.
Seismologists categorize Cascadia region earthquakes into 4 different types, depending on where they occur, (their "source zones"). Three types, Cascadia Megathrust, Deep Intraplate, and Crustal Faulting earthquakes, may occasionally produce strong shaking that can threaten life and property. The fourth type, volcanic earthquakes, are generally too small and remote to cause damage directly, but they provide strong clues about potential volcanic eruptions.
While only one type (Cascadia Megathrust) actually ruptures a plate boundary, all of these earthquakes can be understood to result from Plate Tectonics.
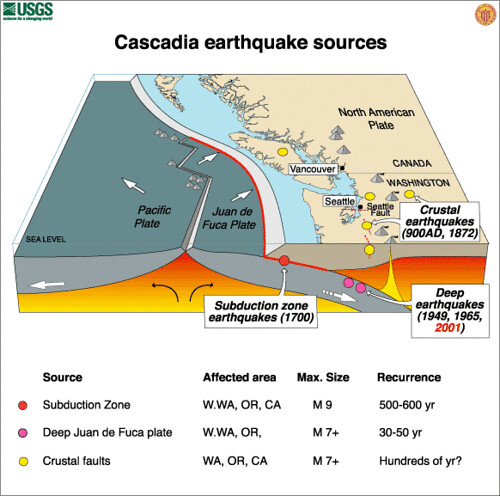
In Cascadia strain arises from the interaction of three tectonic plates. The North America, Juan de Fuca, and (indirectly) the Pacific Plate all are moving with different trajectories. Offshore from British Columbia, Washington, Oregon, and N. California, a young oceanic plate called the Juan de Fuca Plate is spreading away from the Pacific Plate and plunging beneath North America. [You might think of building a salami sandwich by holding 2 slices of bread together, and shoving the salami in from the side -- not very efficient, and you're likely to get Mayo everywhere!]. Temporarily locked together (since the great Cascade Subduction Zone Earthquake of 1700), strain is building in the locked interface between these two plates that will be released in future earthquakes. Read more about the Cascade Subduction Zone.
The crust of the Juan de Fuca plate consists basalt and marine sediments, is itself placed under strain as it is forced beneath North America and down into the Earth's mantle. The slab is bent and pulled by gravity. In a zone from near the coast line to the foothills of the Cascades but centered on the Puget Lowland, breaks in this subducting slab produce Deep Intraplate earthquakes. Most of the damaging historic earthquakes in Washington State were from this deep earthquake source.
Shallow or Crustal Earthquakes occur on faults in the North American Plate. Some are so shallow they can break or deform the ground surface. Others can occur up to 35 km deep and may not be associated with faults observed at the surface. Strain from the Cascadia Subduction Zone plays a role in some crustal earthquakes in Western Washington and Oregon but shearing of California as the Pacific Plate grinds along the western edge of the North American Plate to the south plays a bigger role in the generation of crustal earthquakes.
Volcanic earthquakes are triggered by changes in the magmatic system within and beneath the volcano. When magma is injected or removed from the system, surrounding rock will either shift to make room for the injected magma, or fill in a vacated area. These actions are the cause of volcanic earthquakes.
Data Products and Seismic Analysis
PNSN Website
pnsn.org has many tools for accessing information about earthquakes in the Pacific Northwest.
The Recent Earthquakes Map displays all local events that occurred in the past two weeks. The control panel gives users the option to change the display of the earthquakes on the map and to draw cross sections in order to analyze the data.

QuickShake is a realtime display of seismic data, straight from the seismic monitoring instruments in the field. With QuickShake, PNSN employees and the public can view the same data, replay events, and search for earthquakes.
QuickShake is a work-in-progress that we aim to develop into a useful tool for earthquake science.

The Custom Earthquake Search allows users to search for PNSN events with any parameters that they choose. The most common filters are: magnitude range, date range, and a latitude/longitude bounding box.

ShakeMaps
ShakeMaps are produced by the USGS using data from regional seismic networks. The maps display ground motion and shaking intensity from earthquakes. ShakeMaps are a great demonstration of the decreasing felt intensity as the distance from the epicenter increases.
The ShakeMap from one of the most recent felt events in the PNSN regional boundary.

The ShakeMap from the 2001 M6.8 Nisqually Event.

USGS Did you Feel It?
The USGS Did You Feel It? maps display reports from people about shaking and damage from earthquakes. Did You Feel It maps are available on the PNSN event page for events that are large enough as well as the USGS page. These maps are generated by the resposes of citizens and help seismologists confirm that their instrument recordings and modeling actually reflect what people felt.
The image below is also from the Nisqually and was generated by tablulating the survey results from over 26,000 people. Compare the DYFI map below with the ShakeMap above.

Earthquake Early Warning and USGS ShakeAlert
Earthquake Early Warning (EEW) is a system being developed by the USGS and regional networks, like the PNSN, that will give people advanced warning about earthquakes that have occured and may be felt in their region.
Here in the Pacific Northwest, we are working to upgrade and install more stations in order to better our coverage and improve the reliability of EEW in the region.
Currently, the program ShakeAlert is used to send notifcations to users about earthquakes. This technology is still being developed.