Spectrograms - Tremor
This type of signal is not a transient signal such as from a single earthquake but is rather a continuous low-frequency signal sometimes observed at volcanoes and more recently during periods of the newly discovered phenomenon called Episodic Tremor and Slip (ETS) or slow slip. The sources for both remain poorly understood, but may be related to sustained pressure fluctuation commonly associated with fluid movement and/or from many very small low-frequency earthquakes occurring in rapid succession. Tremor at volcanoes is a common precursor to eruptions and often occurs during eruptions, called eruption tremor. Tremor most commonly has spectral peaks between 1-4 Hz, although it may be as high as 10 Hz. It may be continuous for hours to days, or it may start and stop on much shorter time scales (often called “spasmodic tremor”). Tremor associated with ETS periods often varies slightly in amplitude over periods of minutes to 10s of minutes.
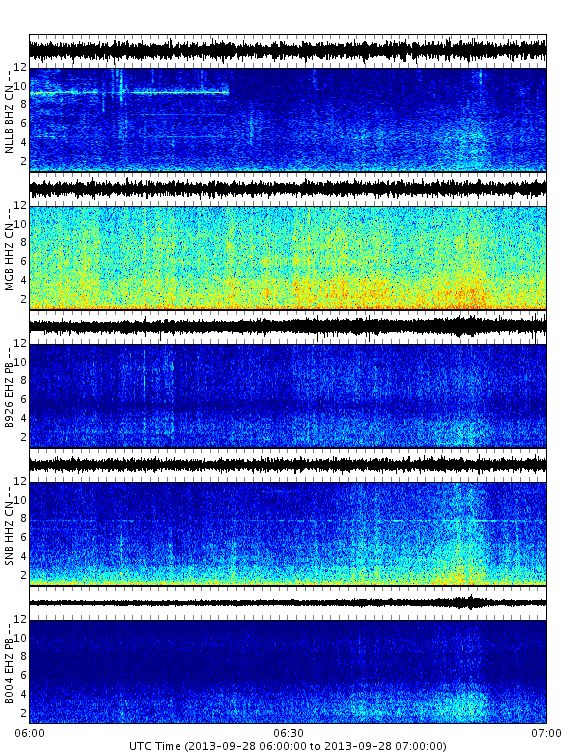
Because the tremor source is located within the earth, it will be recorded by several or all of the stations in a geographical sub-group (this is partly dependent on signal amplitude and depth). This is a key feature that helps distinguish it from other continuous seismic signals such as that from wind.

Above and below are examples of ETS tremor observed on the northern Washington (NW) above and southern Vancouver Island (BC) below sub-groups of stations. Note that these spectrograms are one hour long and so the tremor takes place and varies in amplitude over several minutes to 10 minutes.
Below is an example of ETS tremor observed on the Northern California (NC) sub-group of stations.


