Magnitude/Intensity
Perhaps no seismic subject is as irksome to seismologists as discussions of earthquake size. There often seems to be no end of confusion, misunderstanding, and over-interpretation of what are really pretty crude metrics. And when news announcers mention the "Richter Scale" seismologists the world over begin gnashing their teeth.
Magnitude
A familiar analogy to help understand earthquake size metrics is to think about a light bulb. One measure of the strength of a light bulb is how much energy it uses. A 100-watt bulb is brighter than a 50-watt bulb, but not nearly as bright as a 250-watt bulb. The wattage of a bulb tells you about the strength of the light source. In the same way, an earthquake's magnitude is an objective measurement of the energy radiated by an earthquake. However, earthquake magnitude has no physical units, nor a meaningful 0. This is because we can't easily measure the energy the way we can with an electric circuit, so seismologists commonly use a relative measure. It is easier to choose a particular earthquake recorded at a particular distance as a "standard" earthquake and call it a magnitude 1. An earthquake that causes ground motion at a seismic station (when corrected for distance) 10 times larger than the reference earthquake is M2. An earthquake causing motion at that distance 10 times larger than an M2 is an M3, and so on. To achieve this ten fold increase in ground motion requires about 32 to 33 times the energy. When referring to the power or energy released in an earthquake this 32 multiplier is used. An earthquake that releases about 33 times less energy and causes motion 10 times smaller than an M1 is an M0--and magnitudes can even go negative.
This Live Science animation will help you visualize the exponential magnitude scale in terms of energy released.
Intensity

Earthquake intensity measures how strongly the earthquake impacts a specific location. In the light bulb analogy, it is the brightness with which you perceive the light at a place in a room. Can you read a fine-print book by the lamp? Pick up a needle? Perform delicate surgery? Depends on the wattage of the bulb, and how far you are from it, right? If you mapped out the brightness in terms of what you could accomplish at the light level in a room, you'd have an intensity map.
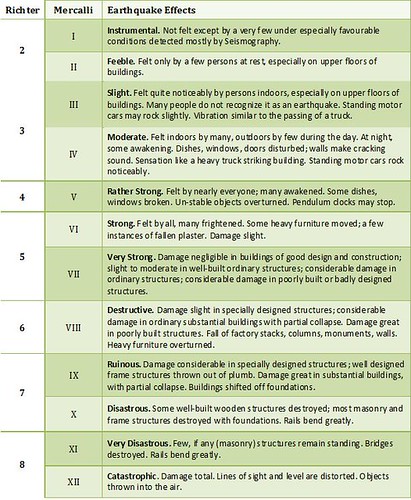
Well, you can make a map of earthquake impacts using the Modified Mercalli Intensity Scale (MMI), which derived from an earlier ten-degree Rossi-Forel scale, later revised by Italian vulcanologist Giuseppe Mercalli in 1884 and 1906 to quantify (somewhat) the earthquake's effects. Further refinements for more modern construction were published in 1931 by the American seismologists Harry Wood and Frank Neumann. Measurements of intensity using the Modified Mercalli scale, are composed of 12 increasing levels that range from imperceptible shaking to catastrophic destruction, usually designated by Roman numerals, which stresses their semi-quantitative nature. Whereas an earthquake will have one magnitude (well, as noted below, there are likely to be several different estimates of the magnitude of an earthquake depending on the type of estimate etc.), for each individual earthquake there will be a range of intensities depending in part on the magnitude of the source, but also the location of the site at which the intensity was observed.
More about Magnitudes - The 3 Approaches
If you've had some time to think a bit about the Earthquake/Light bulb analogy you probably have come up with some questions, like: But some bulbs are blue and some white and some yellow, what gives with that? And, fluorescent fixtures put out really different quality light than incandescents, and are brighter for the same wattage, eh? And, what about a flash bulb from my camera which is incredibly bright...but just for a fraction of second? And, if my room is filled with steam or smoke, is the intensity still the same? These are all good points; it turns out that similarly for earthquakes the complexities and variability of earthquake rupture processes and of seismic waves as they travel through Earth (and evolving seismometer design and sensitivities) there are different methods for measuring the magnitude of an earthquake. These may return a slightly different number when used to estimate the energy released in an earthquake.
In overview, there are three approaches to using seismograph recordings to quantify earthquake sizes, with numerous flavors of each. One approach is to use some measure of peak amplitudes recorded on seismograms. A second is to use the duration of shaking recorded. A third is to try to match the actual waveform wiggle-for-wiggle with a mathematical model (a "synthetic seismogram"), and report the size of the modeled earthquake.
1. Amplitude based Magnitudes (Local, Body Wave, Surface Wave)
The oldest and most famous magnitude measurement method, the Local Magnitude (it used to be referred to as the Richter magnitude), was developed by Dr. Charles Richter and Beno Gutenberg of Cal Tech in 1935. Written as ML, it remains the go-to method for measuring small- to medium-sized earthquakes within 600 km from the recording seismograph. Richter used seismograms recorded on a particular instrument, the Wood-Anderson torsion seismograph. Today, we use more modern instruments and account for their response to mimic what the historical Wood-Anderson seismograph would have produced. Richter's motivation for creating the local magnitude scale was to measure the ratio of small- to medium-sized earthquakes. It was never intended to measure large or distant earthquakes. All amplitude-based magnitudes rely on a base-10 logarithm of the peak amplitude measured by a seismograph. This is because there are many factors of 10 difference between the smallest and largest amplitudes of observed ground motions. An earthquake that measures 5.0 on the Richter scale has a shaking amplitude 10 times larger and corresponds to an energy release of 31.6 times greater than one that measures 4.0.
Body wave magnitude is a similar concept, but applied usually to teleseisms -- earthquakes more than 3000 km from the recording station -- and good for deep and shallow earthquakes.
Surface wave magnitudes measure the surface waves that are generated by large regional to teleseismic earthquakes, and that travel long distances without losing much energy from absorption.
In general local magnitudes "saturate" (lose resolution) for earthquakes exceeding M5.8 or so, body waves stay on scale to somewhat larger magnitudes, while surface wave magnitudes saturates at about M8 or so. This is in general because of the frequencies of the seismic waves that each use. The higher-frequency methods (local, duration) can't see the difference between larger earthquakes, while the low frequency measures (surface waves, moment magnitude) characterize the long-wavelength energy that radiates from a bigger rupture surface.

2. Duration Magnitudes (coda magnitude)
Another estimate of magnitudes is particularly useful when recordings "clip" and you can't measure the peak amplitude. This is called the coda magnitude, or duration magnitude, and is derived from the observation that the ratio of peak amplitude to the duration of shaking from an earthquake are related. PNSN often calculates the size of PNW earthquakes using the durations averaged from a number of seismograms to obtain "Md" estimates. In the past a seismic analyst picked the duration on each seismogram by eye independently, which was somewhat subjective and variable, as the background noise varies greatly. The modern method, made possible by faster computers, is to model the decaying amplitude of the seismogram in order to automatically and objectively define a duration.
3. Waveform Modeling (moment magnitude)
Modern digital seismic instrumentation, modern seismic theory, and most of all modern high-speed computers have permitted us to be able to model seismograms wiggle-for-wiggle. To do this, we use a standard model of the Earth and of the source to generate synthetic seismograms, and the computer adjusts the location, size, and orientation of the rupture to match the observed waveforms. The magnitude that is derived from waveform modeling is called the Moment magnitude, and it is in some ways the most precise estimate of earthquake size--and the only one applicable to great earthquakes M>8. Of great interest is that since we can observe the deformation of the Earth from such big earthquake ruptures, we have an independent estimate of the energy they released, so that we can (finally!) relate the magnitude to the energy released during rupture.
It is worthwhile to note that all of these approaches have been calibrated and defined with respect to each other such that they all agree, on average, in the ranges in which they overlap. So for general purposes an M8 is an M8 is an M8, regardless of the method that generated it. But also it is interesting that Richter's original local magnitude was the one that all the other techniques generally matched up with (since it was first) so, in a sense, the "Richter Scale" that news reporters often cite (to the chagrin of us seismologists) is really a pretty apt homage.
Magnitude and Energy
Below is a representation, from the Geological Society of America, of earthquake magnitudes and the equivalent energy release. (For the life of us, we don't know why the geologists used pounds of explosive as a proxy for energy instead of a real physical unit of energy, such as Joules! But the figure makes the point, anyway.)
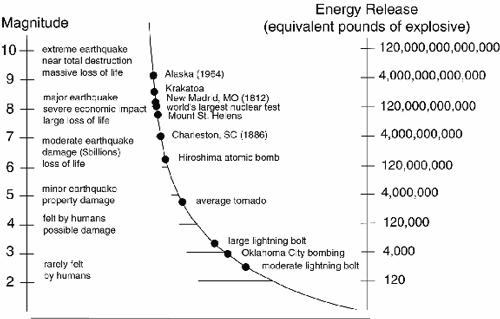
Notice the relationship is not linear? The change in the amount of energy released from one magnitude to the next is greater as the earthquake magnitude increases. For example, the difference in amount of energy released from a magnitude 5 to a magnitude 10 is not double, it is 30 million times as much!
Need some further practice relating Earthquake Magnitude to Energy? No problem, the USGS calculates the difference between a 5.8 and 8.7 earthquake and has a calculator where you can input your own numbers to see how much bigger an earthquake can get with different magnitudes.
Magnitude Vs. Intensity
The chart below claims to compare Richter Scale magnitudes with intensities in a very generalized way--as if a "Richter magnitude" was somehow measuring the same thing as a "Mercalli intensity". Now that you know the basics of earthquake Magnitudes and earthquake Intensities, you know that this chart makes no sense. If you see it or a similar representation, you can be assured the provider of the information is unencumbered by knowledge of the basics.
One Final Word - a Plea for Understanding
Now that you know how many different approaches there are to measuring an earthquake, and how it depends on the traces that you use, and instrument types that you have available and how far they are from the earthquake, and how many there are....
Perhaps you'll understand why our magnitude estimates change with time immediately after an earthquake as we try to be both as fast and as accurate as possible. And why different organizations will post somewhat different magnitudes for the same earthquake.
A rule of thumb, perhaps, is that in the early minutes (or tens of minutes) after an earthquake up to a half a magnitude unit of difference between estimates will generally be shrugged off by seismologists as reasonable scatter. But differences larger than that usually mean that there was a fairly serious problem...like the entirely wrong technique was used, or critical data were omitted.