Interpret Displays
Displays Interpretation Primer
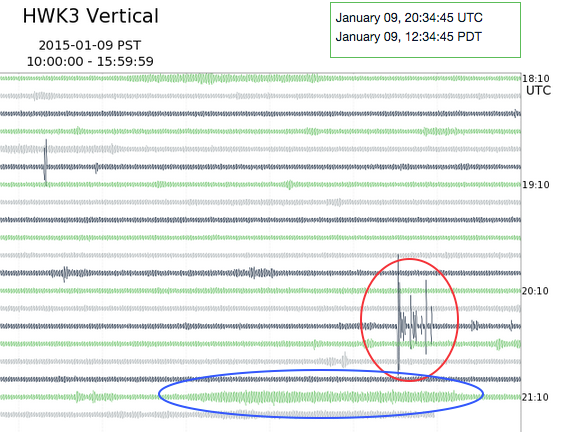
Seismograms (including hawk-o-grams, fan-o-meter2 and QuickShake displays) are graphical representations of ground vibrations over time at the respective sensor locations. Time increases from left to right (and for Hawk-o-grams top to bottom). The size of the wiggles on the traces is proportional to ground acceleration at the site. These are very sensitive instruments and thus most signals observed in this football game monitoring case are very small with motions much less than 1% g (Where 1.0 g is the acceleration of gravity, ie what we feel just living on the earth). Ground motion in excess of 1 g (ie 100% g) would throw you in the air. Normally one can start feeling ground vibrations as small as 0.1% g and vibrations in excess of 10% g can damage buildings. All of our displays have constant scaling (though for the QuickShake display you can change that with a slider). See our FAQ for comparing ground motion for Seahawk games with real earthquakes.
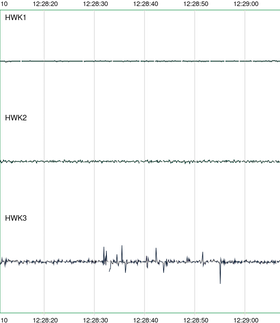
Our three different displays have different characteristics based on the length of the displayed record and how many channels. It may be interesting to compare a particular signal, such as a train passing near the stadium, on all three display types.
Some examples of what we think different signals mean:
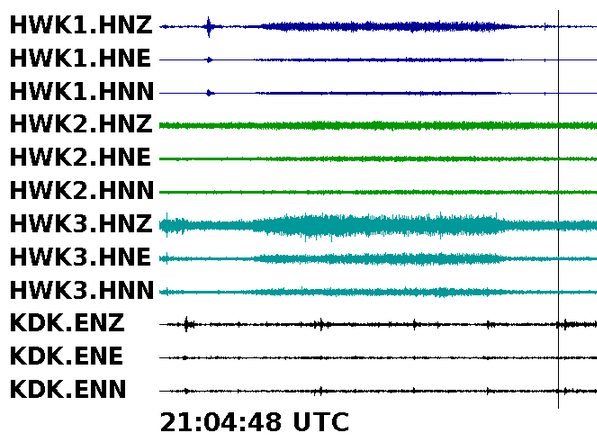
Here is an example of the fan-o-meter2 showing the same train signal. Note that signals on the vertical channels (HNZ) are larger than on the horizontal ones (HNE, HNN). HWK2 and KDK are far from the tracks and thus show little or no train signal.
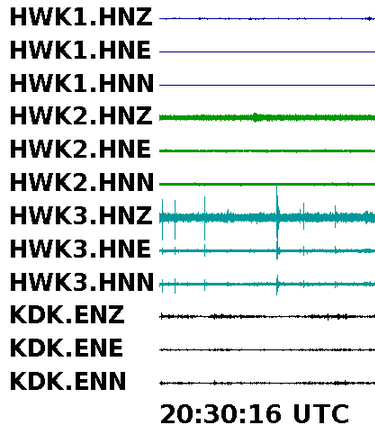
PNSN Station KDK
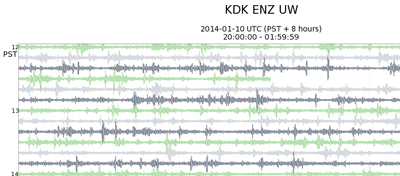
Station KDK is located very near the US-99 ramp leading up to the Alaska Way Viaduct and so any vehicle starting up the ramp will shake the ground. Trucks, in particular are probably producing the larger signals. Thus Seahawk fans need to be bigger and stronger than vehicles on the nearby roadway to show above the traffic signals.