What is a Spectrogram?
To view PNSN's seismic spectrograms, go here: Spectrograms.
What is a spectrogram?
A spectrogram is a visual way of representing the signal strength, or “loudness”, of a signal over time at various frequencies present in a particular waveform. Not only can one see whether there is more or less energy at, for example, 2 Hz vs 10 Hz, but one can also see how energy levels vary over time. In other sciences spectrograms are commonly used to display frequencies of sound waves produced by humans, machinery, animals, whales, jets, etc., as recorded by microphones. In the seismic world, spectrograms are increasingly being used to look at frequency content of continuous signals recorded by individual or groups of seismometers to help distinguish and characterize different types of earthquakes or other vibrations in the earth.
How do you read a spectrogram?
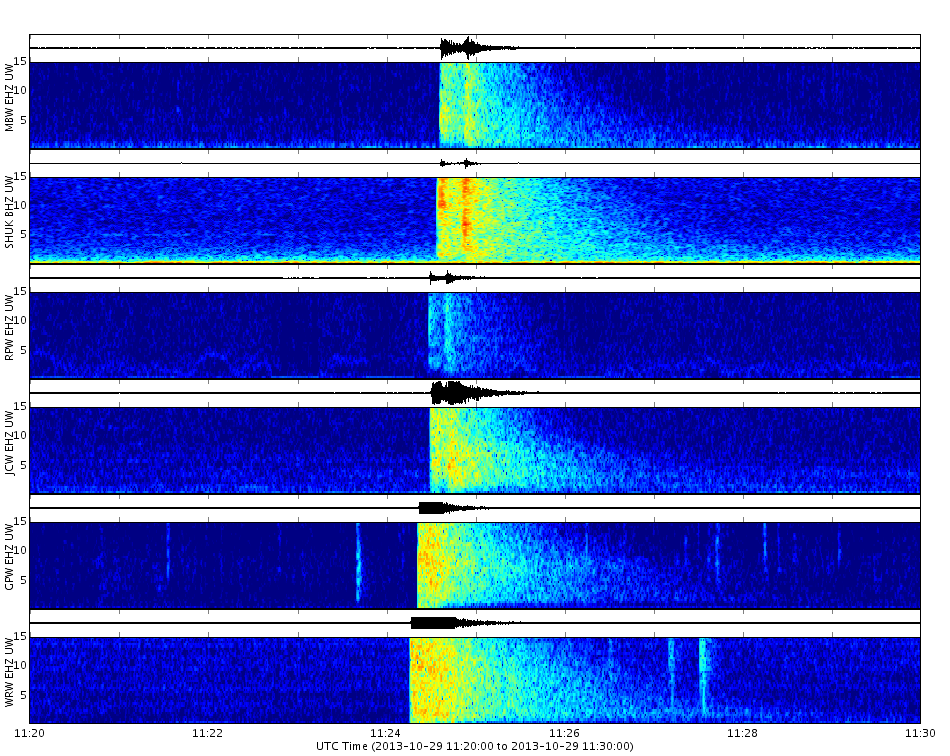
Spectrograms are basically two-dimensional graphs, with a third dimension represented by colors. Time runs from left (oldest) to right (youngest) along the horizontal axis. Each of our volcano and earthquake sub-groups of spectrograms shows 10 minutes of data with the tic marks along the horizontal axis corresponding to 1-minute intervals. The vertical axis represents frequency, which can also be thought of as pitch or tone, with the lowest frequencies at the bottom and the highest frequencies at the top. The amplitude (or energy or “loudness”) of a particular frequency at a particular time is represented by the third dimension, color, with dark blues corresponding to low amplitudes and brighter colors up through red corresponding to progressively stronger (or louder) amplitudes.

Above the spectrogram is the raw seismogram, drawn using the same horizontal time axis as the spectrogram (including the same tick marks), with the vertical axis representing wave amplitude. This plot is analogous to webicorder-style plots (or seismograms) that can be accessed via other parts of our website. Collectively, the spectrogram-seismogram combination is a very powerful visualization tool, as it allows you to see raw waveforms for individual events and also the strength or “loudness” at various frequencies. The frequency content of an event can be very important in determining what produced the signal (see examples).
Why does each spectrogram page show several different spectrograms?
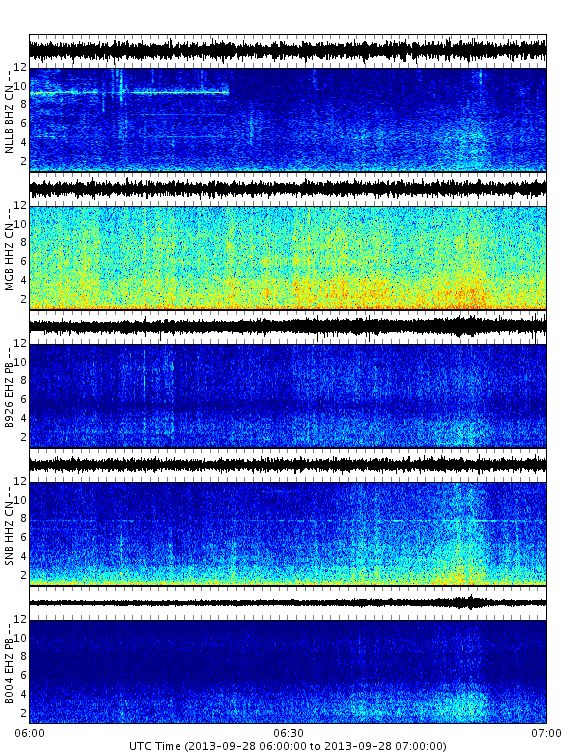
Our spectrogram web pages show groups of spectrograms from multiple stations, usually 5 to 7, with the stations ordered from closest (top of the multi-spectrogram display) to furthest (bottom) relative to a point of interest such as a volcano. Weak seismic sources that originate at or above the surface (wind gusts, animal footsteps, helicopters, thunder, car traffic, etc.) will generally only show up on a single station, whereas stronger sources that occur at or below the earth’s surface (earthquakes, blasts) will generally show up on multiple stations. Showing spectrograms for multiple stations on the same plot allows scientists to quickly determine whether a particular signal is generated by a weak or a strong source and is at the surface or within the earth and therefore distinguish between “noise” (signals from sources in which we usually have no interest) and a signal that is more geophysically significant. Of course the most interesting sources to us are those generated within the Earth such as earthquakes, volcanic eruptions and rock-fall/avalanches.
Interpreting spectrograms
There are three major categories of earthquake that you may see on spectrograms. These are divided according to distance from the seismic network and are traditionally called local (within the Pacific Northwest), regional (near the Pacific Northwest such as from British Columbia, California or offshore) and teleseisms (more than 1,000 kilometers or 600 miles from the Pacific Northwest). Of course there are many types of “noise” signals we record; a few examples are given here.