Fan-O-Meter
Fan-O-Meter is a NEAR realtime live feed that shows three channels from four stations (oriented in the vertical (ENZ), East-West (ENE), and North-South (ENN) directions. This display is just a static image of the last 10 minutes of waveforms for each channel. The image is updated every 10 seconds with new data appearing on the right and everything else sliding to the left so it looks like traces jerking along over time. Time stamps at the bottom are for the oldest point on the left and the newest point on the right. These times are given in Universal time (UTC) because seismologist all work on international time, not local time. UTC (sometimes called GMT or Zulu is 8 hours ahead of Pacific Standard Time). Note that some traces are missing a bit on the far right which means the image is updated before the latest data are fully ready for displaying.
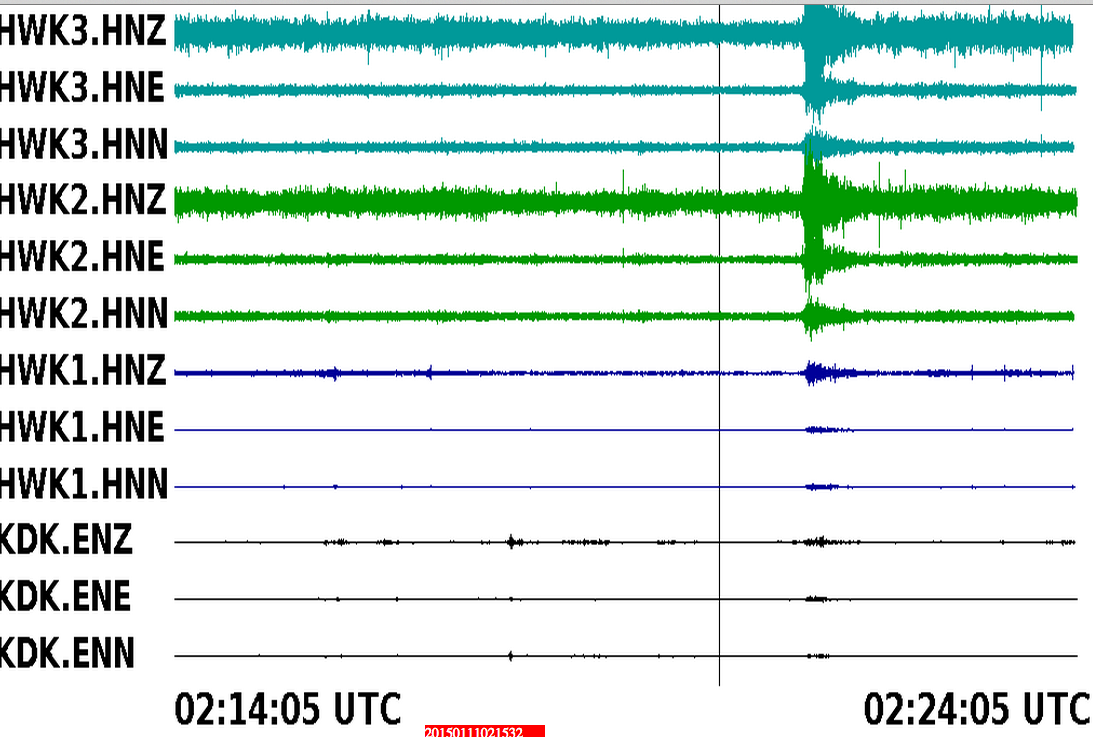
Here is a sample of the Fan-O-Meter during the first half of 2014 NFC Divisional Round. It shows fairly high levels of fan activity gradually diminishing over several minutes but near the end is an obvious bigger burst of fan activity that is well recorded on all stations including KDK, which is outside the stadium. This corresponds to the Kearse catch and TD run.