ETS Event of Fall 2021
Deep Tremor News: Fall 2021 - Spring 2022
This BLOG-like page is being generated in a form similar to previous ETS ones to document and provide information on a Northern Washington - Southern Vancouver Island (NW-VI) ETS that sarted in September 2021. There are no special experiments in the field for this ETS. We will be tracking and reporting on this ETS using data only from the real-time regional networks (UW, UO, CN, PB, CA) and/or information reported to us by others.
Produced by Steve Malone, PNSN Professor Emeritus
ETS dates:
Start: Sep 22, 2021 End: Oct 11, 2021 for Washington part
Start: Mar 20, 2022 End: Apr 6, 2022 for Vancouver Island part
Information will be posted on this page (latest at the bottom) and references to figures from time to time.
NEWS (latest is at the bottom):
Oct 5, 2021 - Wait a minute. This 2021 ETS is not supposed to start until about 14 months after the last one started which would make it due to start sometime in Dec, 2021. Yet it looks as if something has already started. As of today significant tremor has been going on in the central Puget Sound region since Sep 21 or 22. Typically we feel that if tremor goes on every day for 10 days then a real/significant ETS is under way. So, it now seems that is the case.
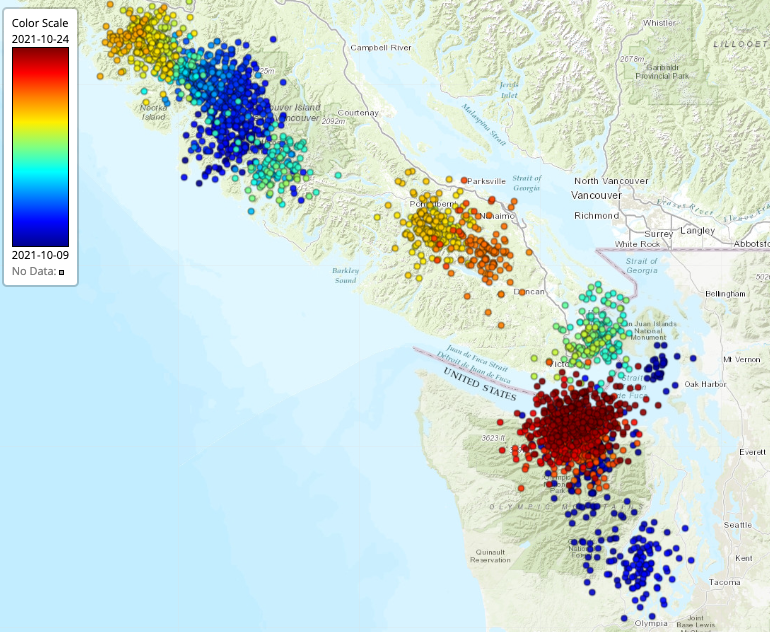
This batch started in a similar way to many previous ones. The earliest tremor is fairly weak and down-dip (to the east). It then moves up-dip (to the west) and then spreads slowly to the north and/or the south. In the current case it seems to be moving slowly north reaching just north of the Olympic Peninsula and even with a small patch jumping across to Vancouver Island as of today. There is even a scattering of tremor locations up in central Vancouver Island which is an area usually associated with an ETS in the NW-VI region. Here is a map of these tremor locations color coded by time (blue - earliest and red - latest).
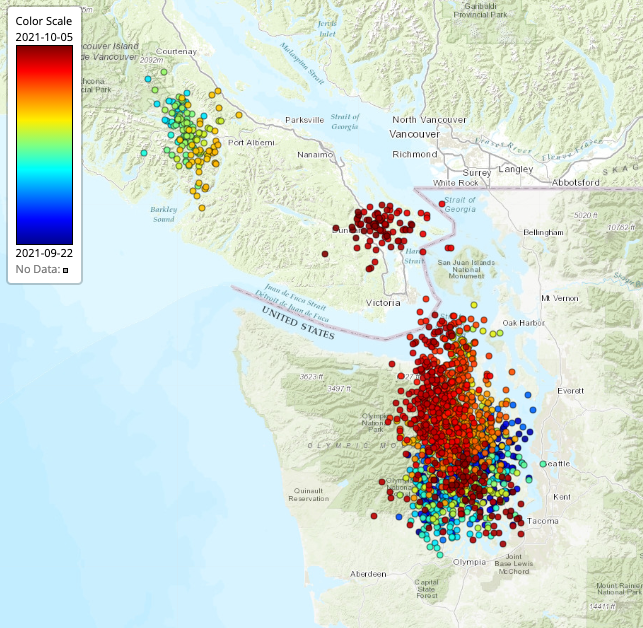
So, how unusual is such an early start and is there any significance to it? It is pretty unusual though there have been at least one recorded case when a part of the normal NW-VI ETS region had tremor only about a year since the previous one (2013). Because of the variability of the way these ETS events take place we have no idea if there is any special significane to this early start. It may be just another slightly different way these events unfold. I will not stick my neck out at this time and try to predict how this may progress since there is every chance that it will quit in a day or two and not really get going for another two months.
By The Way - Within a week or so our tremor catalog will be updated based on processing of all the data since 2017 with the latest and most robust algorithms for tremor detection. This "Version-4" catalog is not that much different from the Version-3 catalog that has been displayed for the past couple of years. This latest version should have more uniform detections over the whole length of Cascadia and also is less prone to noise glitches in the seismic data that have generated spurious tremor locations in previous catalogs.
Also, We may be able to soon provide more routine views of the geodetic data that helps to define the location and size of an ETS. Our geodetic spcialist at the PNSN has developed some processing and display techniques that we may be able to easily reference. Also, I can find no evidence in any of the geodetic data I have looked at that there is slip going on now... but what does a retired seismoloist know about geodetic data.
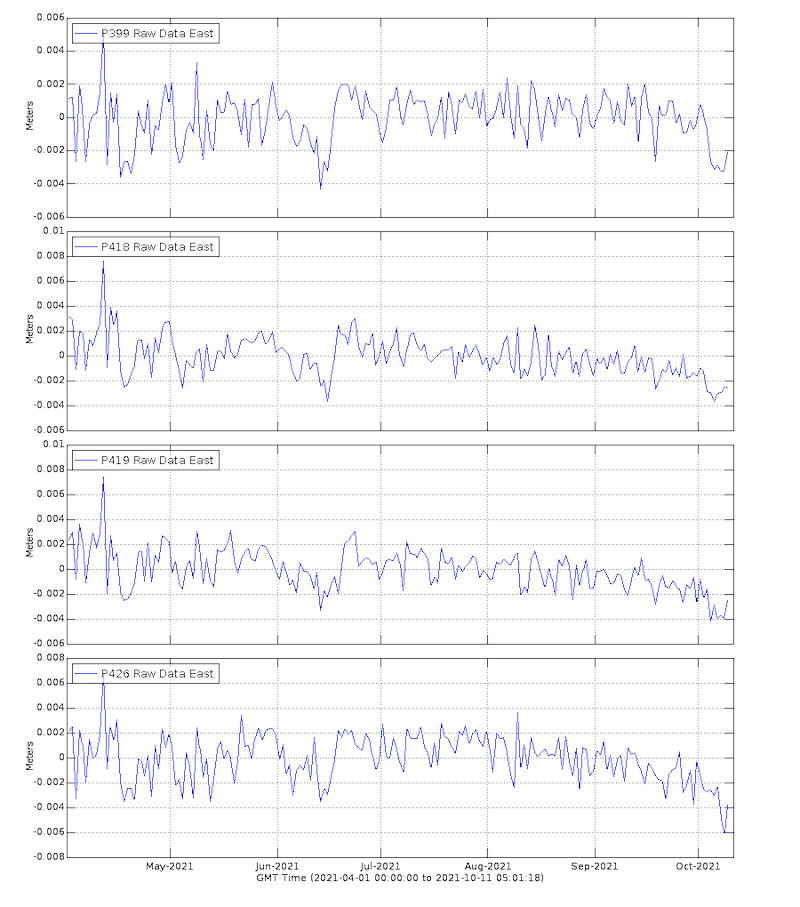
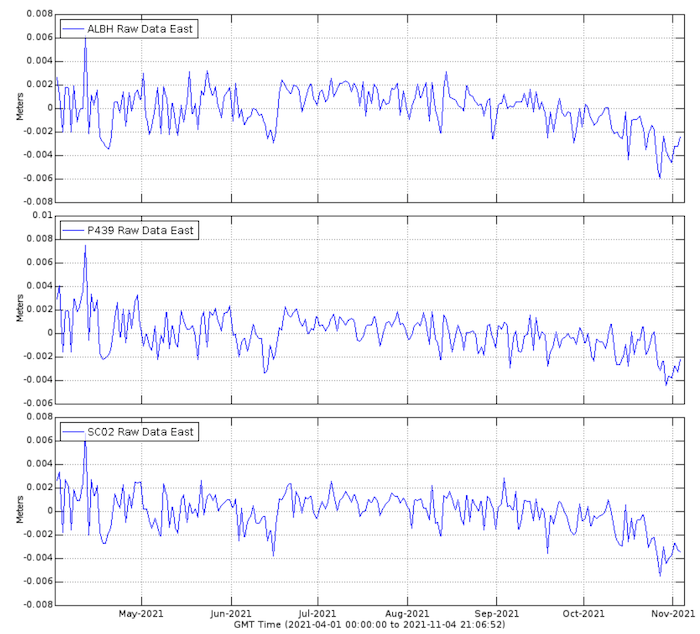
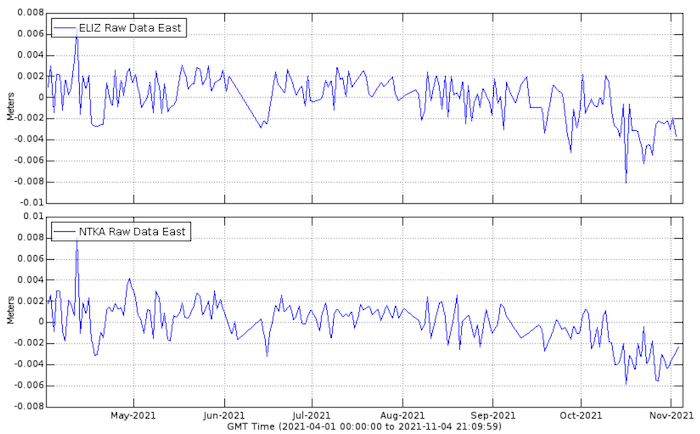
Oct 10, 2021 - This ETS is continuing primarily in the Olympic Peninsula but with some bursts on southern and even central Vancouver Island. Also, within a day of my last post I got word from our local geodesist, Brendan Crowell that detectable motions on several GPS monitoring sites can be resolved. Over the next several days this motion is now obvious, even to a seismologist. After looking at the time-series from many/most of the sites with good data in this region I selected the following four sites to illustrate the motions detected. These plots are for the east-west component derived from a system maintained by the Cascade Volcanic Observatory (CVO) who are particularly interested in motions on and around volcanos. However, their system acquires data from the processing centers for most geodetic monitoring sites all over the Pacific Northwest. While these plots go from April 1, 2021 to now and show daily/weekly variations around 2-3 mm of motion (noise in the data) it is pretty obvious (to me) that these motions deviate significantly downward on the plot (toward the west) starting at about Oct 1. The latest values are 4-6 mm below the mean over the past six months, which I am told is significant enough to indicate substantial displacements on the plate interface 30-40 km below the instruments. This detectable displacement lags the detectable tremor onset by over a week. This is typical and to be expected since any single tremor burst is generated by very small motions on a small patch of the interface and many of these must take place before the total area and displacement adds up to be enough to see the actual long term displacement at the surface.
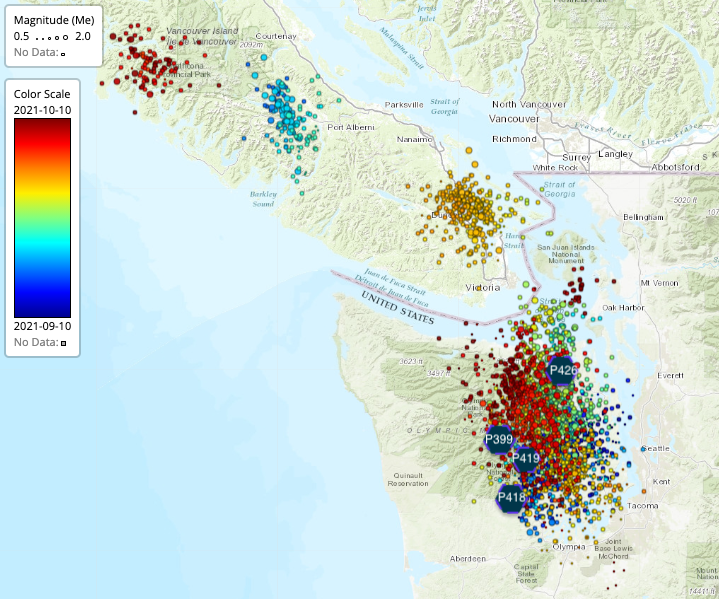
On the following time-by-color map of the tremor since Sep. 22 I show the location of the four GPS sites with detectable motion as of now. I would expect other GPS sites to have resolvable motion show up in the future if this ETS continues and spreads either north or south. The relatively short bursts of tremor on Vancouver Island are not yet enough to resolve motions there… at least by me. If this ETS progresses to include the area typical of a WA-VI ETS then I would expect some of the areas north of Washington to fill in with more tremor locations over the next few weeks.
Now to address a few questions and comments received by various social media sources. Some folks may be confused by what is shown and numbers given on our tremor page. Keep in mind that this page covers all of Cascadia by default and this blog mostly addresses the ETS that we have been studying in detail that goes from southern Puget Sound north to south-central Vancouver Island. This was the first ETS discovered by Rogers and Dragert (2003) using GPS and seismic data going back to 1996. One can isolate this area by clicking the “Add geographic filter” box and “pulling” an area on the map. Actually a good way to learn about all the fancy bells and whistles available on this cool interface is to click the “Start Tour” box in upper right corner.There have been other comments about when a particular ETS starts and/or stops and if the inter event time is significantly decreasing. Indeed, while the exact start and stop times I have chosen for this blog are somewhat subjective I have tried to use the same criteria in all cases. One thing that complicates this process is that any given ETS does not necessarily cover the exact same area as a previous one covering the same general region. Also, while tremor generally starts in the down-dip (eastward) part of the plate interface and then migrates up-dip (westward) before it starts migrating either north or south (or both directions) it sometimes jumps leaving a space without tremor for a while. Usually it fills in the gap sooner or later but sometimes it is much later. The previous ETS in the NW-VI region was just such a case not filling in the gap between the Washington part and the central Vancouver Island part until just over two months later. See the log entry for fall 2020 ETS. Thus there is the semantic question if these were one long ETS with a hiatus or two separate ones because of both the time and distance separation.A good way to visualize this complexity is making a plot of the latitude component of tremor locations versus time such as provided to me by Ken Creager who used the revised, latest catalog for the most recent five year period. I consider the NW-VI ETS section to extend from the latitude of southern Puget Sound (47.2°N) to the latitude of Vancouver, BC (49.2°N) (dotted lines on the plot below). I used the Tremor density by ETS plots to determine these rough boundaries. One can see that some tremor patches extend outside these latitudes or don’t quite fill them totally but I consider these a good general rule to use. Clearly the tremor patterns north of latitude 47° are different than those south of it. For a general discussion of the different regions and their characteristics (particularly that of the California section south of latitude 43° see the very nice summary provided by one of our grad-students, Carolyn Nuyen called “Silent Rumble Under Our Feet”.
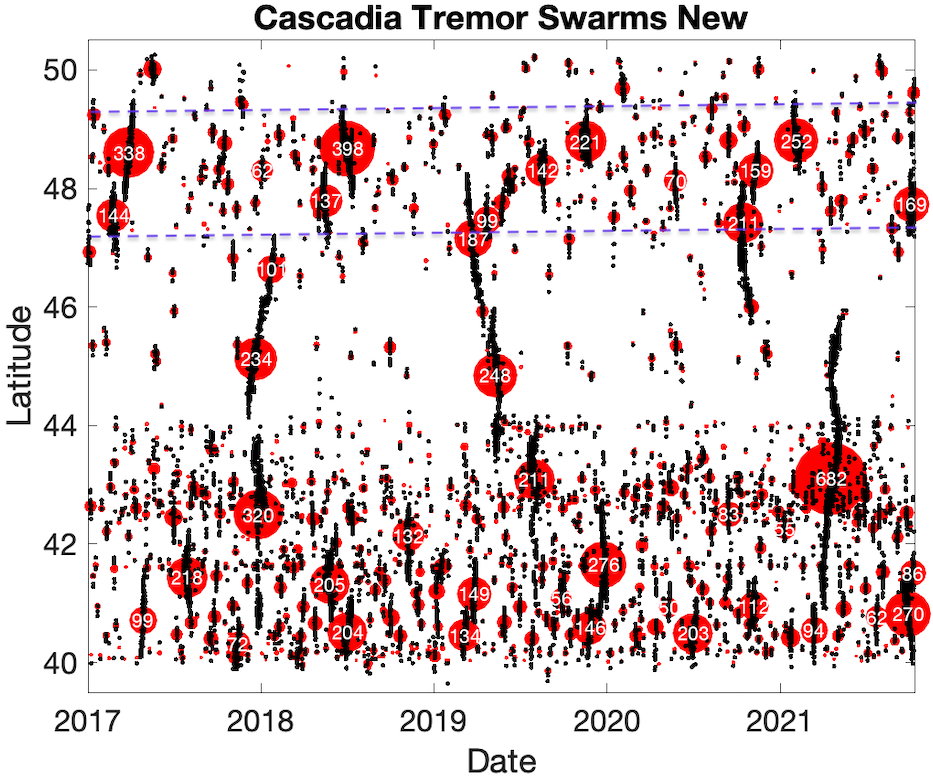
On the above plot tremor locations are shown as black dots and the red circles mark a set of tremor events that are considered linked in a space-time group that probably represents a slip event even though most of them (smaller) do not have resolvable slip in the GPS data. The number of hours of tremor in each group are displayed if there are more than 50 hours. A rule of thumb is that numbers over 100 hours will have resolvable slip in the GPS data. Note that the latest time period has 169 hours of tremor and, as stated above, now has well resolvable GPS recorded slip. Also note that there are patches of tremor north of the main patch which can be seen on the above map. It remains to be seen if this northern area will fill in with more and enough tremor that resolving the slip geodetically will be possible.On a subsequent post I will try to address comments about changes in the inter--ETS time and its possible relevance to real earthquakes.
Oct 24, 2021 - It does seem like this ETS is complicated similar to the previous couple in this area. Within a day of my previous blog post it seems that the main northern Washington (WA) part of the tremor sequence died out with the last bit on Oct 11. For over a week it was mostly quiet here until about Oct 20 when again strong tremor picked up along the northern edge of the Olympic Peninsula. Looking at the same set of GPS instruments as shown in the above figure it looks as if the offsets leveled out about the same time (~ Oct 12).However, about the same time that the WA section stoped, a section in northern Vancouver Island started up. The following figure shows a color-coded-by-time tremor map for the dates Oct 9 - Oct 24 (today). The dark blue shows a burst in northern Vancouver Island (NVI) and the last bit of tremor in the central Puget Sound area. The NVI bunch spreads some south and quite a bit north forming a section about 120 km long which may represent a specific ETS in this area for which I think there seems to be a hint on a couple of GPS stations with offsets in this area. The tremor map also shows a few bursts in the southern Vancouver Island area (SVI). These were pretty low level tremor on only a few of the days during this period and probably do not represent any true ETS event. Thus it would seem to me that the more typical (of the period 2007 - 2018) pattern of the whole WA-SVI) going in a more or less continuous single large ETS is being broken for the current and previous couple of events. They now separate with the WA part going first and the SVI part going some time later. At least we expect this SVI to fill in within a month or two.
I am going to now take a break in the details of this current ETS and address a more general question that has been triggered by comments on our FaceBook group. I am not a FaceBook contributor but do appreciate the comments and discussions found there. In fact I think this illustrates a value of the citizen scientist, which I have blogged about in the past. In this case a David McD calls attention to what he sees as an increasing frequency for ETS events that could be leading to a mega-thrust earthquake. He references a scientific paper by Luo and Liu that uses rate-state theoretical modeling with appropriate fault zone parameters to suggest changes (shortening) in ETS timing are likely to occur in areas adjacent to those initiating a large earthquake. They give one example where this may be the case. Being retired I have not taken the time to try to understand all of the details of their modeling (even assuming I have the intellectual capability to do so). Of course, there are a number of different published models that invoke various relationships between ETS and mega-thrust earthquakes, the simplest being that the slow slip during such events increases the load on the up-dip, locked section increasing the likelihood it a large event during or just following an ETS. Any number of these models or several of them may be correct but thus far there are not enough data points to support any of them.In our current ETS case a legitimate question to ask is the following: is the ETS timing shortening a significant amount? As with lots of complicated data it all depends on how one measures the timing and what the “normal” variations can be before a change would be considered “unusually short”. In the FaceBook comments Noel B (who, unlike me, is a real geodesist with lots of experience looking at Cascadia slow-slip events) suggests there is no consistent pattern of changes in the timing from 2006 - 2019). As a seismologist looking at the tremor patterns from 2003 to the current one I would agree; some are shorter and some are longer than the average of about 14 months with a variation of plus or minus a month. In querying some of my colleagues I got a thoughtful response from Herb Dragert (the fellow who along with Garry Rogers discovered the ETS phenomenonin Cascadia almost 20 years ago). They use both GPS and seismic data that allow them to get approximate timing for ETS events going all the way back to 1982 (34 ETS episodes). Their data are for stations in southern most Vancouver Island and thus do not include ETS events farther south in Washington or in central or northern Vancouver Island. Herb sent me the following on Oct. 19: These 34 episodes have an average recurrence interval of 426 days with a sigma of 60 or 39 days. The smaller sigma omits a "doublet" (long-followed-by short recurrence of 584 days followed by 291 days) which occurred over 1989 to 1992. If one considers the current ETS event to be underway now, the time interval from the previous event is within the 1-sigma range of variance and therefore would not be a clear diagnostic for the likelihood of a mega-thrust earthquake as proposed by LUo and Liu.Also, Herb notes that based on where their data are from (SVI) the ETS has not yet started so it is not early. Thus, I would say that before we start worrying about an imminent “big one” we keep watching and waiting. That is not to say an earthquake could not occur tomorrow just that we feel that the data is not consistent with a significant shortening of the ETS interval even if the theory is right. Of course, one should be prepared no matter what.
Nov. 4, 2021 - A few days before writing the above blog post tremor started again in the central Olympic Peninsula and gradually moved north onto southern Vancouver Island. While at first this seemed to be just minor bursts in the same area active a few weeks earlier as it moved north it got stronger and more continuous. When it stopped on Oct 31 I figured that it probably didn't amount to enough to be considered a real part of a full ETS. This burst didn't even last a full two weeks. However, I recently looked at some of the geodetic data and am now convinced that it did represent slow slip on the ETS part of the subduction zone under the most southern part of Vancouver Island. Below I show three of the GPS stations in southern most Vancouver Island followed by two stations in northern Vancouver Island near the area that had tremor between Oct 9 and 19. Note that each set of time sequences shows a downward offset during October. However the northern pair show the transition earlier in the month while the southern three later in the month (though the fursterest south statin, ALBH may start the downward deviation earlier since it may be partially effected by slow slip taking place earlier in the northern Washington area.
Indeed, this ETS is probably a bunch of smaller segments going off at differernt times. While not included in previous blogs the most northern of these segments reported here has gone from time to time in the past. In fact it was quite active with well recorded sequences of tremor druing the period 2012 - 2016. In subsequent years it didn't seem as active but it may have been a detection issue since the number of seismic stations being used to detect tremor in this area been more variable over time than in the south. So the question remains if this whole ETS is yet over or will a section in souther-central Vancouver Island light up. Some observers are betting on it.
This post was written by UW Emeritus Professor Ken Creager.
April 6, 2022 - The latest blog post for this ETS was November 4, 2021. It ended with a question: Is this ETS over, or will a section of southern-central Vancouver Island light up. Finally, 5+ months later the question is answered, yes, from March 20, 2022 until today, and probably more days into the future, southern Vancouver Island tremor has been very active. It started in the north and is migrating south as can be seen in this map with tremor color-coded by date.

A map of tremor under Vancouver Island in Spring 2022, showing tremor moving southeast.
While most ETS events start down dip and migrate up dip before starting to migrate along strike, this tremor swarm has started at mid depths.
From about 2007 through 2016 the northern Cascadia Episodic Tremor and Slip tended to have a large along-strike extent and be large: 385 to 620 hours of tremor per ETS. In the last 5 years, however, this zone has been segmented near the US/Canada border with a complex sequence of events distributed in time in the US followed by one to several months by nearly identical events in southern Vancouver Island. These tremor swarms are similar both in hours of tremor and in along-strike extent of tremor as can be seen on the plot of date versus latitude below. Individual tremor epicenters are shown as black dots and tremors that are clustered in space and time are marked by red circles. Those with more than 50 hours of tremor show the hours as white numbers. The one marked as 247 is the current ongoing tremor swarm and it is very similar in latitude distribution to the previous events with 251 and 223 hours. Prior to that, 2 slightly larger swarms had similar northern cutoffs but migrated slightly further south.

Graph of locations of Cascadia tremor since 2017, with events plotted by date and latitude.
Aug 18, 2022 - Indeed the last batch of tremor reported above by Prof Creager stopped within a day of his post (Apr 7, 2022) but his observation of the northern Cascadia tremor section (Puget Sound - Vancouver Island) taking on a different pattern over the last five years seems to be continuing. In early August a nine day burst of tremor took place right in the eastern Straights of Juan de Fuca. While this burst of tremor didn't last long enough to be considered a full ETS (10+ days) it did have both a slightly up-dip progression before moving slightly south to north. It likely could be considered an "inter-ETS" event but what these things are called is starting to get quite arbitrary. In any case the very regular 14 month cycle between large ETS events in this region seems to have changed over the past several years. Thus trying to anticipate when the next large event will occur is beyond me. However, the total tremor (and assumed slow slip) still fills in the whole zone if averaged over several years.