Beast Quake (Taylor's Version) (From The Vault)
For 12 years, the most exciting ‘seismic’ event in the Pacific Northwest was triggered, not by a fault, but by an incredible athlete and a stadium full of fans. The crowd’s energetic reaction as Marshawn Lynch rushed for 67 yards, broke through nine tackles, and clinched a playoff win for the Seattle Seahawks was significant enough that it registered on a seismic station, KDK, located across the street from Lumen Field on Occidental Ave. This fan-quake, dubbed the ‘Beast Quake’, was followed up with years of comparisons to other events at Lumen Field. However, like aftershocks following a main event, none of those subsequent events managed to upstage the original…in notoriety, if not size.
When Taylor Swift visited Seattle as part of her 2023 ‘Eras Tour’ and performed two consecutive nights of sold-out concerts at Lumen Field, it was asked if the concerts registered on the same station, KDK, that recorded the Beast Quake. With 70,000+ ‘Swifties’ in attendance each night and music blasting out of every speaker, it was inevitable that something would be recorded, so Jackie Caplan-Auerbach (Associate Dean of the College of Science and Engineering/Professor of Geology at WWU) took up the challenge to compare the data from the Beast Quake to that of the Taylor Swift and her fans. The figure below is what she came up with.

Original 'Beast Quake' vs 'Shake It Off' fan-quake.
The actual Beast Quake lasted about 2 minutes with the largest shaking recorded in about a 40 second period during the moments right after the touchdown. Jackie compared the seismic trace from 2011 to about 4 minutes of data from the second night of the concert and in direct comparison, the ground shook more during the Swift concert than it did during the Seahawks game. To be clear, neither event "caused" nor "triggered" an earthquake and any magnitude assigned to them is, at best, very approximate. Even though these events were not earthquakes, there is still much more that can be learned from these data.
Curious seismologists at the PNSN wanted to know what the data recorded at KDK sounded like and if the music was identifiable in that recording. The call went out for any PNSN Swifties to identify the songs that were playing during an 8 minute segment of the concert using the sonofied ground motion recording. Sonofied earthquakes are created by mapping the frequencies in an earthquake into audio frequencies that are then playable and, perhaps, recognizable as a song. At the time, the only additional data at hand was the set list, a rough idea of when the concert had started, and a PNSNer who had attended the Sunday show. Listening to the audio was not enough to identify the songs and further analysis was needed using a program actually meant for audio files. The recording had two distinct segments that were reasoned to be separate songs and were analyzed separately. Using the available ‘beat finder’ function and some guess work, they estimated that there was a beat every .372 seconds, or, 161 BPM.

The full 8 minute audio file with two distinct songs (using the application Audacity).
While the BPM identified in the second part of the recording was close enough to that of ‘Shake It Off’ at 160 BPM to reasonably identify it, the estimations involved in finding the BPM made the method difficult to repeat for other sections of the concert. This meant that there needed to be a more repeatable way to consistently identify the BPM.
The solution was to use a Fourier Transform to figure out which frequencies were detected by the seismometer. The results of the Fourier Transform, a mathematical operation that takes time-series data and converts it into the frequency domain, was a graph that shows the strength of every frequency in the seismic wave. Those frequencies were then used to find the BPM of the waveform. The resulting graph showed that most prominent frequencies were 36.62 BPM, 161.13 BPM, and 322 BPM. Since 36 BPM is slower than any Taylor Swift song, it was eliminated. The remaining options of 161 and 322 BPM, had a common factor, which indicated that the frequency equivalent to 322 BPM was only a product of the fundamental frequency of 161 BPM, which matched the results of the earlier analysis.

Results of the Fourier Transform, with peaks at 161.13 BPM and 322 BPM.
Of the 40+ songs performed at the concert, there were only two that had a BPM of around 160: “…Ready For It?” and “Shake it Off”. Application of the same transformation process to the first song in the audio segment resulted in a tempo of 95 BPM. This eliminated “Ready For It”, as it was preceded by the song “Tolerate It”, with a beat of 75 BPM. On the other hand, “Shake It Off” was preceded by “Blank Space”, which has a rhythm of 95 BPM. Thus, the mystery songs in the segment were proven to be “Blank Space” and “Shake It Off”.
The following video includes the original sonofied ground motion recording, a version that is filtered to make it more audible, and the audio playing in sync with the original song recording. The original audio is very faint.
With the identification of the song analyzed by Jackie as “Shake It Off”, the ‘Swift Quake’ or ‘Beast Quake (Taylor’s Version)’ was born. While Taylor’s Version might have caused more shaking than the original, it was not entirely a fair comparison. Each event at Lumen Field, the game in 2011 and the concert in 2023, was packed full with 70,000+ people, but Taylor’s concert had the additional help of extremely loud music, which could have given the concert attendees an advantage of coordinating the random jumping and dancing into a more synchronous reaction. Another caveat is that these phenomena are not necessarily unique to Taylor Swift and her fans, instead, this was just the first concert to be analyzed this way at Lumen Field.
For many years, a topic of debate around the PNSN has been, ‘was the movement registered at the seismic station caused primarily by fan movement (i.e. jumping or dancing), by noise (i.e. music or shouting), or some indeterminable combination of both’. Steve Malone, and others, looked further into the matter over the years and identified a ‘Dance Quake’ at Lumen Field in 2015, during the playoff game against the Green Bay Packers, that was larger in amplitude than the original Beast Quake (but didn’t garner quite the same media attention). The ‘Dance Quake’ occurred during a time when fans were chanting, jumping, swaying, and cheering. The two Taylor Swift concerts presented another opportunity to revisit this question. With the help of dedicated fans who attended the concert and recorded video with timestamps, Jackie and PNSN Staff were able to timestamp every song in the first night of the concert and approximate the timing of songs the second night. In addition, the fans gave their observations and videos of crowd reactions and movement. The two nights of seismic data and the corresponding observations were enough to launch another investigation into the cause of the fan quakes.
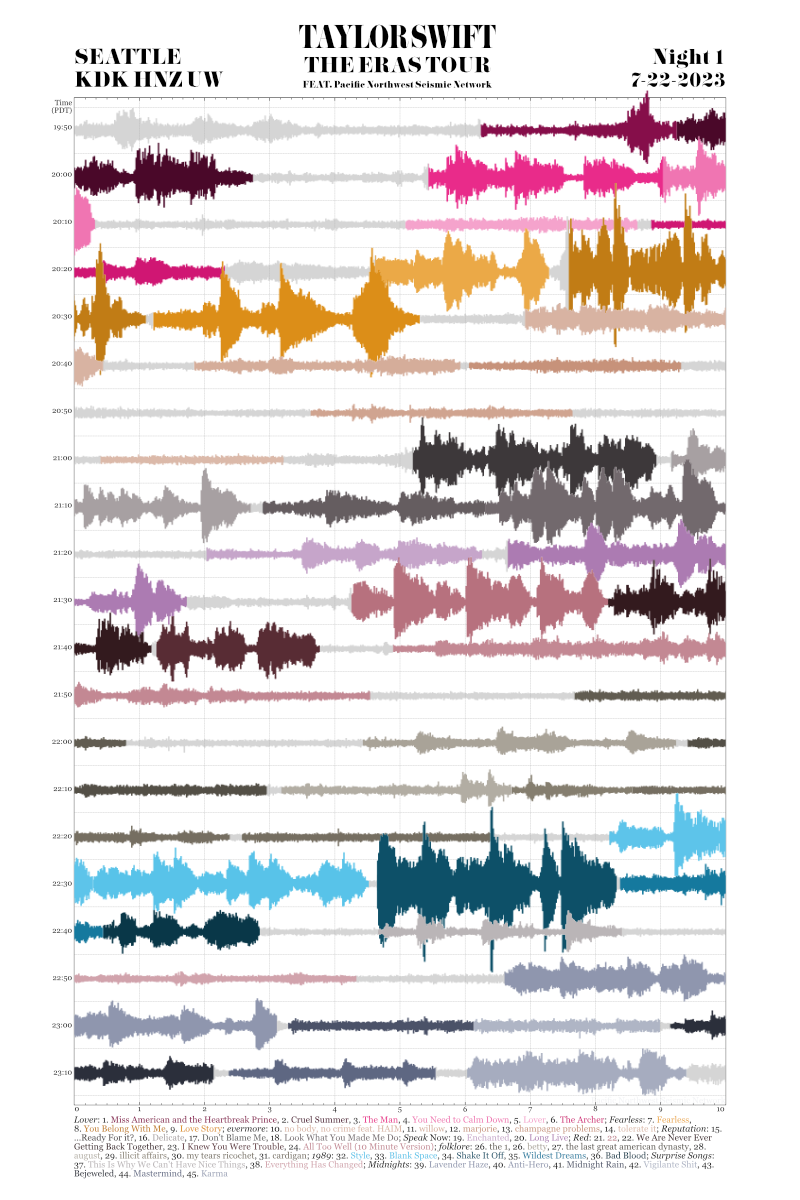
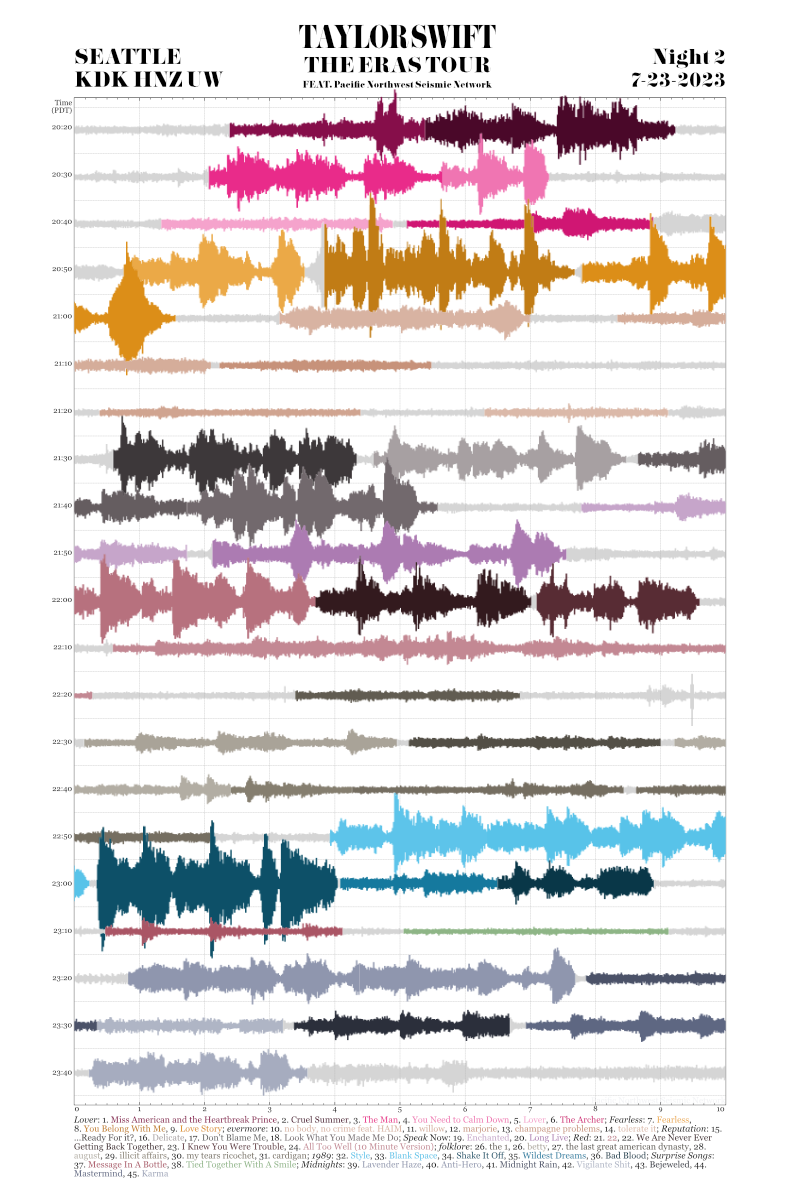
While that study is still ongoing, the timing information and BPM information from songs was used to produce a color-coded seismogram of each night of the concert. PNSN Swifties thought it made a cool poster and produced images to share. The hue and saturation of the colors are unique to each "era" (album) and the luminosity is scaled to the BPM of the songs. As some of the timing for the nights was estimated, the posters will be updated if more precise information becomes available.